Variations in Patterns of Utilization and Charges for the Care of Low Back Pain in North Carolina, 2000 to 2009: A Statewide Claims’ Data Analysis
SOURCE: J Manip Physiol Ther. 2016 (May); 39 (4): 252–262
Eric L. Hurwitz, DC, PhD, Dongmei Li, PhD,
Jenni Guillen, MS, Michael J. Schneider, DC, PhD,
Joel M. Stevans, DC, Reed B. Phillips, DC, PhD,
Shawn P. Phelan, DC, Eugene A. Lewis, DC, MPH,
Richard C. Armstrong, MS, DC,
Maria Vassilaki, MD, MPH, PhD
Office of Public Health Studies,
University of Hawai`i at M?noa,
Honolulu, HI.
OBJECTIVES: The purpose of the study was to compare utilization and charges generated by medical doctors (MD), doctors of chiropractic (DC) and physical therapists (PT) by patterns of care for the treatment of low back pain in North Carolina.
METHODS: This was an analysis of low-back-pain-related closed claim data from the North Carolina State Health Plan for Teachers and State Employees from 2000 to 2009. Data were extracted from Blue Cross Blue Shield of North Carolina for the North Carolina State Health Plan using International Classification of Diseases, 9th Revision diagnostic codes for:
uncomplicated low back pain (ULBP) and
complicated low back pain (CLBP).
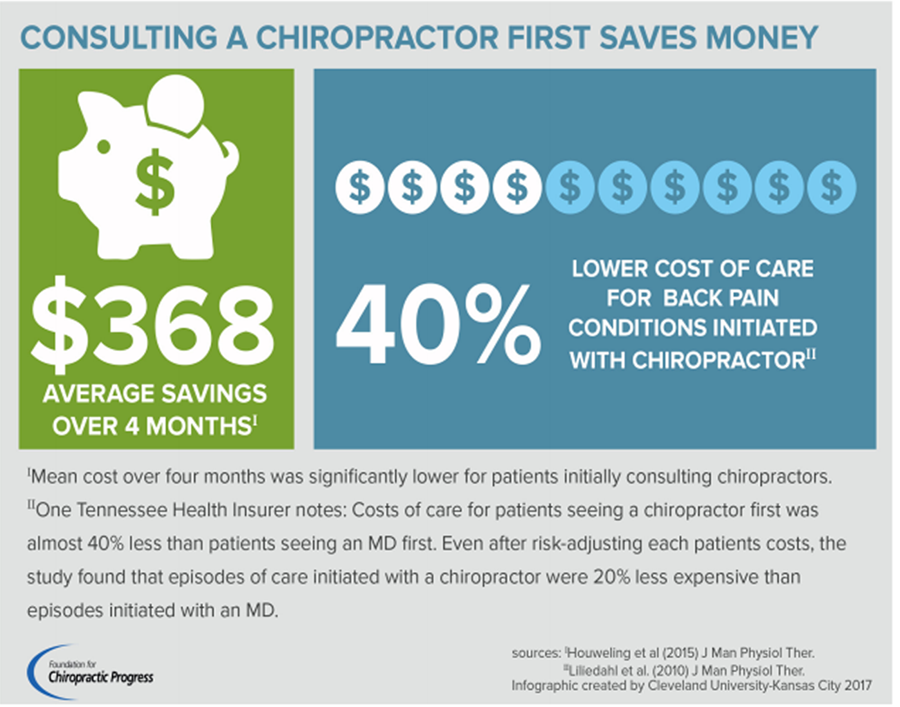
RESULTS: Care patterns with single-provider types and no referrals incurred the least charges on average for both ULBP and CLBP. When care did not include referral providers or services, for ULBP, MD and DC care was on average $465 less than MD and PT care. For CLBP, MD and DC care averaged $965 more than MD and PT care. However, when care involved referral providers or services, MD and DC care was on average $1600 less when compared to MD and PT care for ULBP and $1885 less for CLBP. Risk-adjusted charges (available 2006-2009) for patients in the middle quintile of risk were significantly less for DC care patterns.
There are more articles like this @ our:
CONCLUSIONS: Chiropractic care alone or DC with MD care incurred appreciably fewer charges for ULBP than MD care with or without PT care. This finding was reversed for CLBP. Adjusted charges for both ULBP and CLBP patients were significantly lower for DC patients.
KEYWORDS: Chiropractic; Health Services; Healthcare Costs; Low Back Pain; Medical Care; Utilization
From the FULL TEXT Article:
Introduction
The numbers of reported cases of neck and back problems have increased dramatically. Martin et al [1] reported 14.8 million cases in 1997 and 21.9 million in 2006, a 67.6% increase in 6 years. The Centers for Disease Control and Prevention reported that back or spine problems are the second most common cause of disability in the United States, and noted a 7.7% increase in disability cases due to an aging population. [2, 3] Overall, 1% to 2% of adults in the United States are disabled due to back pain. [4] With spine-related disability increasing, the implications on healthcare policy, spending, and identification of cost effective treatment strategies are enormous.
The rise in prevalence of back pain and increased utilization of healthcare services are driving the costs of the back pain epidemic upward. Martin et al [5] compared the medical costs of 22,258 participants with and without spine problems from 1997 to 2005, adjusting for age and gender. Those with spine problems exhibited a 65% higher increase in medical expenditures from $4,695 in 1997 to $6,096 in 2005 per person. Martin et al also reported that the largest proportion of increasing per user medical expenditures for spine-related problems were for
inpatient hospitalizations (37%),
outpatient costs (18%),
prescription drugs (139%), and
emergency room visits (84%). [1]
Read the rest of this Full Text article now!


Leave A Comment